Introduction to OBI data modelling
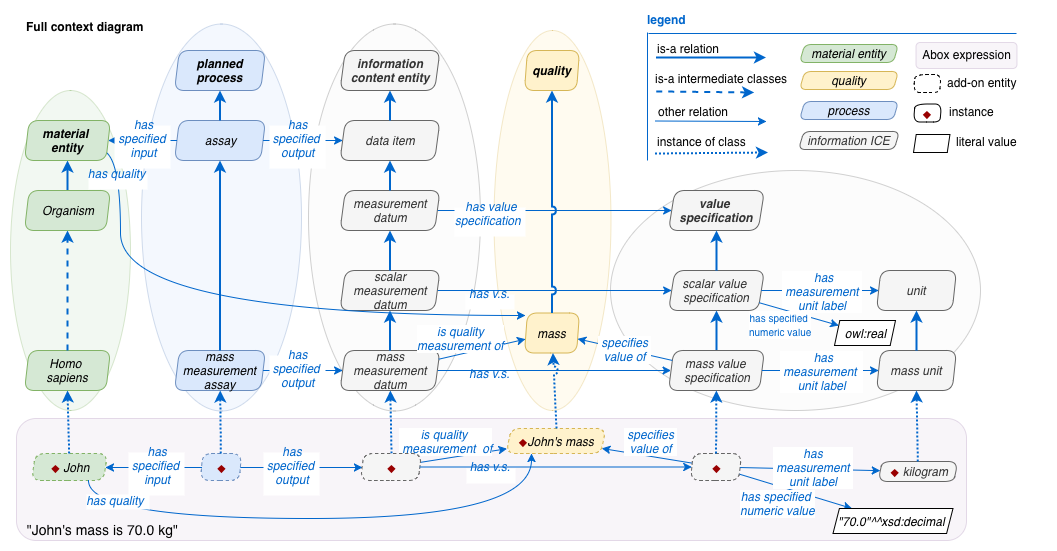
OBI can be used to provide detailed descriptions of test subjects, their qualities, assays measuring those qualities, and the resulting measurements. Consider this example “John’s mass is 70kg”:
The five ovals in four colors help divide the diagram into broad categories:
- the subject John (green), who is a ‘material entity’
- John’s mass ‘quality’ (yellow)
- the mass measurement assay (blue), which is a ‘planned processes’
- the measurement datum (gray), which is an ‘information artifact’
- the “70kg” part of the measurement, called a ‘value specification’, which is another sort of ‘information artifact’
Note that although the diagram shows a full set of OBI classes that are potentially connected to john’s mass, particular reuse of OBI in application ontologies may be much simpler, and skip the process modeling part, the value specification part or the datum part.
In the following sections we discuss each oval, the various classes (boxes) and arrows (object properties and data properties) within it.
Material entities and their properties/qualities
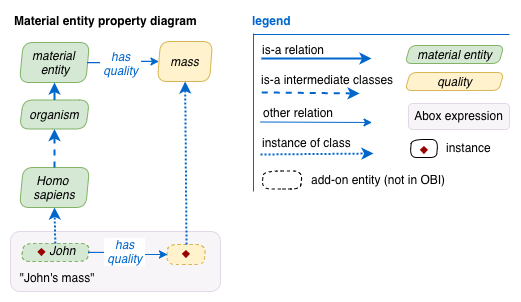
Under ‘material entity’ we find OBI’s ‘organism’ class, which has the taxon ‘Homo sapiens’ as a descendant. The dashed arrow between ‘Homo sapiens’ and ‘organism’ indicates that several intermediate classes have been omitted from the diagram. John is an instance of the class ‘Homo sapiens’, which means he is also an instance of ‘organism’ and ‘material entity’.
John has a particular ‘mass’ quality. We link John to his mass quality with the ‘has quality’ object property. This is an “assertion” or “Abox” statement about instances. We could also assert that any instance of ‘material entity’ ‘has quality’ some ‘mass’ – this would be an “Tbox” or “terminology” statement about classes. As an ontology, OBI focuses on Tbox (class-level) statements, and your data that uses OBI terms will usually focus on Abox (instance-level) statements. This diagram focuses on John and his mass and distinguishes the Abox from the Tbox.

 (
(